Description
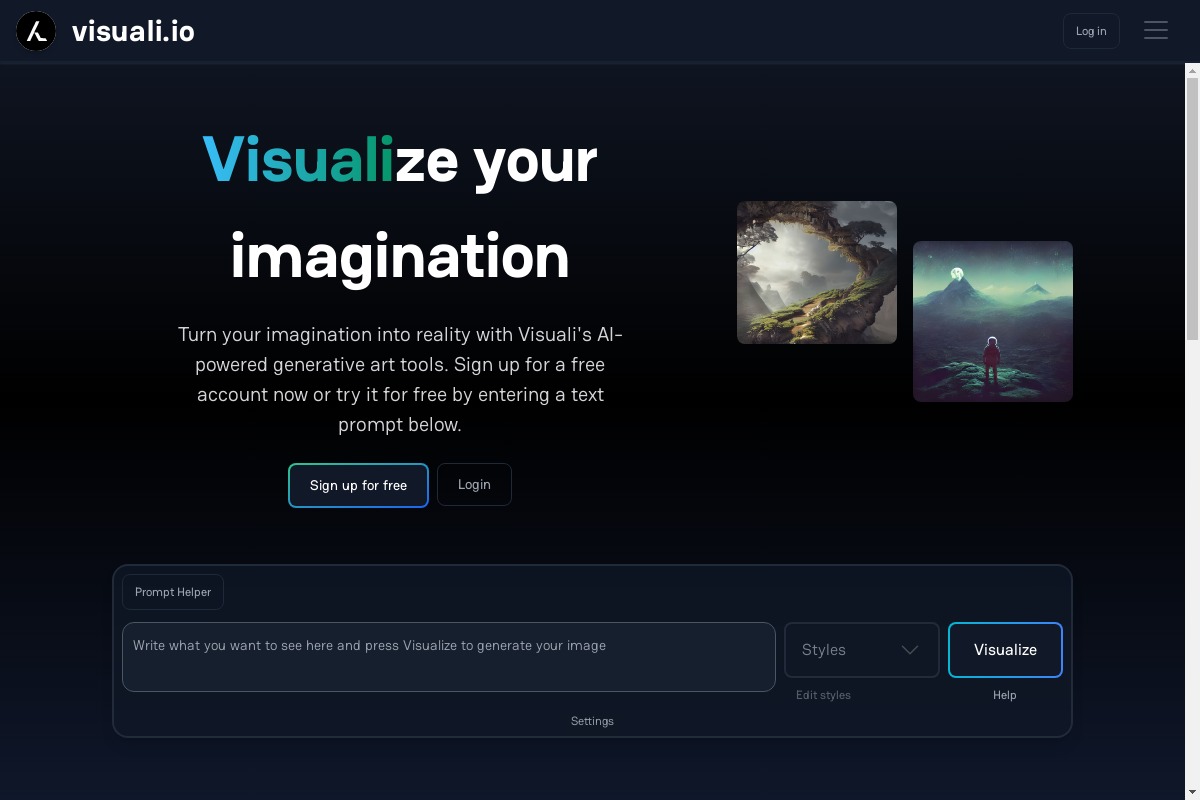
Features of Visuali.io:
- Data visualization tool
- Drag-and-drop interface
- Wide range of templates and themes
- Real-time collaboration
- Export and share options
- Data import and connectivity
- Customization options
- Interactive visualizations
- Mobile-friendly designs
Use Cases of Visuali.io:
- Business presentations: Create visually appealing presentations to engage audiences and communicate complex information.
- Data analysis: Explore and analyze data from various sources, identify trends and patterns, and make informed decisions.
- Team collaboration: Collaborate with team members in real-time to create and refine visualizations, share insights, and make collective decisions.
- Marketing and sales: Design marketing materials, such as infographics and social media graphics, to capture attention and promote products or services.
- Education and training: Create interactive visualizations to explain concepts, illustrate processes, and enhance learning experiences for students and trainees.
- Project management: Track project progress, monitor performance, and visually communicate project status to stakeholders.
- Financial analysis: Visualize financial data, analyze trends, and identify opportunities for growth and improvement.
- Healthcare data visualization: Present healthcare data in a clear and concise manner, enabling healthcare professionals to make informed decisions and improve patient care.
- Research and development: Analyze research data, explore relationships between variables, and present findings in a visually appealing format.
- Customer relationship management: Visualize customer data to gain insights into customer behavior, preferences, and trends, and improve customer engagement and satisfaction.


Reviews
There are no reviews yet.